COMPANY PROFILE -LG Electronics, Inc.
Business Sector :Consumer Electronics and Home Appliances
Operating Geography :South Korea, Global
About LG Electronics, Inc. :
LG Electronics, Inc., was established in the year 1958 under the name of GoldStar. The current company emerged from a merger between Lak-Hui and GoldStar, the initials of which are represented by the “L and G” used today. The company headquarters are located in Seoul, South Korea. LG Electronics has today positioned itself as a global leader and technology innovator in the field of mobile communications, consumer electronics and home appliances. The company primarily deals in the four business units of Home Entertainment, Home Appliances & Air Solutions, Mobile Communications, and Vehicle Components. LG Electronics employs more than 72600 people in 118 locations across the globe as per early 2020 records. In 2020, the company received the Daimler Supplier Award 2020 in the Innovation category for its in-vehicle touchscreen displays. The U.S. Environmental Protection Agency (EPA) has also named it the 2020 ENERGY STAR® Partner of the Year.
The mission statement of LG Electronics reads, “To maintain our hard-earned reputation for bringing added value to the lives of consumers.” The slogan of the company is “Life’s Good”. LG Electronics’s USP or unique selling proposition lies in it being the second-largest LCD television manufacturer in the world.
LG Electronics, Inc. Revenue :
KRW 62.3 trillion (USD 53.0 billion) – FY ending 31st Dec 2019 (y-o-y growth 1.6%)
KRW 61.3 trillion (USD 54.4 billion) – FY ending 31st Dec 2018
Competitive Analysis of LG Electronics, Inc.
The SWOT analysis for LG Electronics is presented below:
| Strengths | Weaknesses |
1. Healthy growth in the Home Appliance Business Unit
2. A Global Behemoth with Strong Brand Image
3. An Extensive Distribution Network
4. Product Mix
5. Straddle Positioning of the Products
| 1. Muted Overall Sales with Mobile Communications Business Unit acting as a drag factor
2. In BCG Matrix Analysis, Cell Phone is in the Dog Category and Smart watch is in Question Mark Category
3. Exposure to Exchange Risks
4. Debt/Equity Ratio
|
| Opportunities | Threats |
1. Growing and Changing Technological Landscape
2. Market Expansion
3. Strategic Alliance/Partnership | 1. Price War with its closest competitors/ Adoption of Red Ocean Strategy
2. Sluggish economic growth of advanced economies and rising raw materials cost
|
On purchase the LG Electronics SWOT and PESTLE Analysis PDF report will reach you within minutes. At rare times, a slight delay not exceeding 4 hours might be caused.
Detailed SWOT Analysis of LG Electronics, Inc.
Strengths
This section is available only in the 'Complete Report' on purchase.
Weaknesses
1. Muted Overall Sales with Mobile Communications Business Unit acting as a drag factor: The company reported sales of 55.37 trillion KRW (USD 49.61 billion) for the year ending December of 2016. When we compare it to the data of 2015, there is decrease of 2.0%. In 2015, company’s sale stood at 56.51 trillion KRW. In fact, the sales level of 2016 is close to the sales level of 2011: in 2011, LG Electronics reported a sale 54.26 trillion KRW. Contributing to this drop in overall sales was the 18.7% decline in Mobile Communications Business Unit from 14.40 trillion KRW to 11.71 trillion KRW. Also, Innotek - an aerospace division of LG Electronics reported a decrease in sales (down 3.0% to 4.67 trillion KRW). Also, Mobile Communications Division constitute 23.03% of the overall revenues.
2. In BCG Matrix Analysis, Cell Phone Business is in the Dog Category and Smartwatch Segment is in Question Mark Category: LCD TVs and Home Appliances come under the category of Cash Cows and hence will keep generating the revenues in bulk. But, the cell phone business with its meagre 3.2% market share is pulling the ship. Also, the Smartwatch business is in the Question Mark Category and investments in the same can have higher risks involved.
3. Exposure to Exchange Risks: LG generates a chunk of its revenue from export model and thus, there is always an exposure to exchange related risks.
Debt/Equity Ratio: With total liabilities being 24499 KRW (bn), Total Assets (2016) equivalent to 37855 KRW (bn) and the Debt/Equity Ratio (2016) being 24499/13356 = 183.43%, it is seen that the company has been heavily taking on debt and thus has high risk.
Opportunities
This section is available only in the 'Complete Report' on purchase.
Threats
This section is available only in the 'Complete Report' on purchase.
The PESTLE analysis for LG Electronics is presented below:
| Political | Economical |
1. Fragile situation on the Korean Peninsula
2. “Chaebol” Reforms
3. USA Protectionism measures
| 1. Global Economy Outlook
2. India, a shining star in the FMCD segment
|
| Social | Technological |
1. Enhanced customer needs, desire to attain social status and an increase in the number of nuclear family
2. Millennials (or Gen Y) and Gen X
| 1. Increasing technology has helped to enhance the manufacturing process and deliver more on quality front
2. Computer Convergence
|
| Legal | Environmental |
1. Legal maze of various lawsuits
2. Implementation of GST in India
3. Electronic Waste Compliances
| 1. Rise of ethical consumerism
2. Rise in the demand of Air Conditioners & Refrigerators with increasing global temperature
|
On purchase the LG Electronics SWOT and PESTLE Analysis PDF report will reach you within minutes. At rare times, a slight delay not exceeding 4 hours might be caused.
Detailed Pestle Analysis of LG Electronics, Inc.
Political
This section is available only in the 'Complete Report' on purchase.
Economical
This section is available only in the 'Complete Report' on purchase.
Social
1. Enhanced customer needs, desire to attain social status and an increase in the number of nuclear family across the globe: With the rapid development of technologies, consumers have become more demanding. They are putting a lot of stress on the companies for innovative features that can satisfy their desire to attain social status. LG Electronics is doing the same with the launch of cell phone models like V20 which has dual screen and dual camera setup or G6 which has an insane screen to body ratio. The demand for newer technologies is also fuelled by a rise in the disposable income and increase in the number of nuclear family across the globe.
2. Millennials (or Gen Y) and Gen X: Millennials constitute 23.46% of the USA’s population – 75.4 million out of the total population of 321.4 million – with annual spending power approaching $200 billion. Also, Gen X population is around 66 million in the USA. The numbers are important because this is the segment that is targeted by companies like LG Electronics.
Technological
1. Increasing technology has helped to enhance the manufacturing process and deliver more on quality front: We have seen that “Robotization” has helped in the cancellation of repetitive process and deliver more on quality front. Similarly, Artificial Intelligence will be the next big thing. Recently, LG unveiled Hub Robot with its in house AI assistant to compete with Amazon Echo and Google Home. AI will accelerate technological fusion of mind and machine and companies like LG Electronics should be prepared for it.
2. Computer Convergence: The idea here is that processing capabilities of mobile devices be increased to such an extent that it can match the performance level of personal computers. It will act as a driving force in the field of “Internet of Things” and companies like LG Electronics should be ready to make the most out of it.
Legal
This section is available only in the 'Complete Report' on purchase.
Environmental
This section is available only in the 'Complete Report' on purchase.
On purchase the LG Electronics SWOT and PESTLE Analysis PDF report will reach you within minutes. At rare times, a slight delay not exceeding 4 hours might be caused.
TABLE OF CONTENTS
DELIVERY AND FORMAT
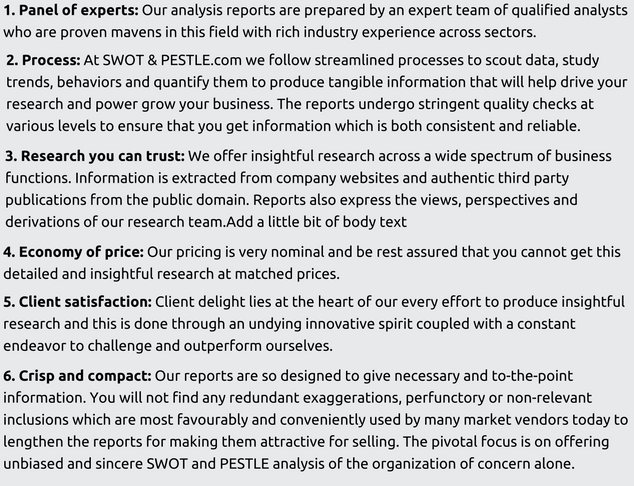
WHY CHOOSE US?
You may also be interested in other analyses of LG Electronics, Inc.:
-
| LG Electronics, Inc. Porter's Five Forces Analysis |
|
-
| LG Electronics, Inc. VRIO Analysis |
|
-
| LG Electronics, Inc. Value Chain Analysis |
|
-
| LG Electronics, Inc. Covid-19 Impact Analysis |
|
-
| LG Electronics, Inc. BCG Analysis |
|
-
| LG Electronics, Inc. Segmentation, Targeting and Positioning (STP) Analysis |
|
-
| LG Electronics, Inc. Ansoff Matrix Analysis |
|
Request for Quotation
We do not share your information with anyone. However, we may send you emails on our new reports and solutions.
Get The Free Sample
Company Overview Report
This report is shared in order to give you an idea of what the complete Company Overview Report will cover after purchase. We invest deep in order to bring you insightful research which can add tangible value to your business or academic goals, at such affordable pricing.
Get this report delivered straight into your email inbox for free.
You also agree to receive email updates from us on our new reports and solutions.
We do not share your information with anyone. However, we may send you emails on our new reports and solutions.
Request for Quotation
We do not share your information with anyone. However, we may send you emails on our new reports and solutions.
Get The Free Sample
Competitor Analysis Report
This report is shared in order to give you an idea of what the complete Competitor Analysis Report will cover after purchase. We invest deep in order to bring you insightful research which can add tangible value to your business or academic goals, at such affordable pricing.
Get this report delivered straight into your email inbox for free.
You also agree to receive email updates from us on our new reports and solutions.
We do not share your information with anyone. However, we may send you emails on our new reports and solutions.
Request for Quotation
We do not share your information with anyone. However, we may send you emails on our new reports and solutions.
Get The Free Sample
Porter's Five Forces Analysis Report
This report is shared in order to give you an idea of what the complete Porter's Five Forces Analysis Report will cover after purchase. We invest deep in order to bring you insightful research which can add tangible value to your business or academic goals, at such affordable pricing.
Get this report delivered straight into your email inbox for free.
You also agree to receive email updates from us on our new reports and solutions.
We do not share your information with anyone. However, we may send you emails on our new reports and solutions.
Request for Quotation
We do not share your information with anyone. However, we may send you emails on our new reports and solutions.
Get The Free Sample
VRIO Analysis Report
This report is shared in order to give you an idea of what the complete VRIO Analysis Report will cover after purchase. We invest deep in order to bring you insightful research which can add tangible value to your business or academic goals, at such affordable pricing.
Get this report delivered straight into your email inbox for free.
You also agree to receive email updates from us on our new reports and solutions.
We do not share your information with anyone. However, we may send you emails on our new reports and solutions.
Request for Quotation
We do not share your information with anyone. However, we may send you emails on our new reports and solutions.
Get The Free Sample
Value Chain Analysis Report
This report is shared in order to give you an idea of what the complete Value Chain Analysis Report will cover after purchase. We invest deep in order to bring you insightful research which can add tangible value to your business or academic goals, at such affordable pricing.
Get this report delivered straight into your email inbox for free.
You also agree to receive email updates from us on our new reports and solutions.
We do not share your information with anyone. However, we may send you emails on our new reports and solutions.
Request for Quotation
We do not share your information with anyone. However, we may send you emails on our new reports and solutions.
Get The Free Sample
Regulatory Outlook Report
This report is shared in order to give you an idea of what the complete Regulatory Outlook Report will cover after purchase. We invest deep in order to bring you insightful research which can add tangible value to your business or academic goals, at such affordable pricing.
Get this report delivered straight into your email inbox for free.
You also agree to receive email updates from us on our new reports and solutions.
We do not share your information with anyone. However, we may send you emails on our new reports and solutions.
Request for Quotation
We do not share your information with anyone. However, we may send you emails on our new reports and solutions.
Get The Free Sample
Risk Analysis Report
This report is shared in order to give you an idea of what the complete Risk Analysis Report will cover after purchase. We invest deep in order to bring you insightful research which can add tangible value to your business or academic goals, at such affordable pricing.
Get this report delivered straight into your email inbox for free.
You also agree to receive email updates from us on our new reports and solutions.
We do not share your information with anyone. However, we may send you emails on our new reports and solutions.
Request for Quotation
We do not share your information with anyone. However, we may send you emails on our new reports and solutions.
Get The Free Sample
Key Performance Indicators (KPI's) Report
This report is shared in order to give you an idea of what the complete Key Performance Indicators (KPI's) Report will cover after purchase. We invest deep in order to bring you insightful research which can add tangible value to your business or academic goals, at such affordable pricing.
Get this report delivered straight into your email inbox for free.
You also agree to receive email updates from us on our new reports and solutions.
We do not share your information with anyone. However, we may send you emails on our new reports and solutions.
Request for Quotation
We do not share your information with anyone. However, we may send you emails on our new reports and solutions.
Get The Free Sample
Environmental, Social, and Governance (ESG) Analysis Report
This report is shared in order to give you an idea of what the complete Environmental, Social, and Governance (ESG) Analysis Report will cover after purchase. We invest deep in order to bring you insightful research which can add tangible value to your business or academic goals, at such affordable pricing.
Get this report delivered straight into your email inbox for free.
You also agree to receive email updates from us on our new reports and solutions.
We do not share your information with anyone. However, we may send you emails on our new reports and solutions.
Request for Quotation
We do not share your information with anyone. However, we may send you emails on our new reports and solutions.
Get The Free Sample
M&A Analysis Report
This report is shared in order to give you an idea of what the complete M&A Report and Analysis Report will cover after purchase. We invest deep in order to bring you insightful research which can add tangible value to your business or academic goals, at such affordable pricing.
Get this report delivered straight into your email inbox for free.
You also agree to receive email updates from us on our new reports and solutions.
We do not share your information with anyone. However, we may send you emails on our new reports and solutions.
Request for Quotation
We do not share your information with anyone. However, we may send you emails on our new reports and solutions.
Get The Free Sample
Subsidiaries, Partnerships and Collaborations Report
This report is shared in order to give you an idea of what the complete Subsidiaries, Partnerships and Collaborations Report will cover after purchase. We invest deep in order to bring you insightful research which can add tangible value to your business or academic goals, at such affordable pricing.
Get this report delivered straight into your email inbox for free.
You also agree to receive email updates from us on our new reports and solutions.
We do not share your information with anyone. However, we may send you emails on our new reports and solutions.
Request for Quotation
We do not share your information with anyone. However, we may send you emails on our new reports and solutions.
Get The Free Sample
Stakeholder Analysis Report
This report is shared in order to give you an idea of what the complete Stakeholder Analysis Report will cover after purchase. We invest deep in order to bring you insightful research which can add tangible value to your business or academic goals, at such affordable pricing.
Get this report delivered straight into your email inbox for free.
You also agree to receive email updates from us on our new reports and solutions.
We do not share your information with anyone. However, we may send you emails on our new reports and solutions.
Request for Quotation
We do not share your information with anyone. However, we may send you emails on our new reports and solutions.
Get The Free Sample
Technology Landscape and Outlook Report
This report is shared in order to give you an idea of what the complete Technology Landscape and Outlook Report will cover after purchase. We invest deep in order to bring you insightful research which can add tangible value to your business or academic goals, at such affordable pricing.
Get this report delivered straight into your email inbox for free.
You also agree to receive email updates from us on our new reports and solutions.
We do not share your information with anyone. However, we may send you emails on our new reports and solutions.
Request for Quotation
We do not share your information with anyone. However, we may send you emails on our new reports and solutions.
Get The Free Sample
Covid-19 Impact Analysis Report
This report is shared in order to give you an idea of what the complete Covid-19 Impact Analysis Report will cover after purchase. We invest deep in order to bring you insightful research which can add tangible value to your business or academic goals, at such affordable pricing.
Get this report delivered straight into your email inbox for free.
You also agree to receive email updates from us on our new reports and solutions.
We do not share your information with anyone. However, we may send you emails on our new reports and solutions.
Request for Quotation
We do not share your information with anyone. However, we may send you emails on our new reports and solutions.
Get The Free Sample
Key News and Events Report
This report is shared in order to give you an idea of what the complete Key News and Events Report will cover after purchase. We invest deep in order to bring you insightful research which can add tangible value to your business or academic goals, at such affordable pricing.
Get this report delivered straight into your email inbox for free.
You also agree to receive email updates from us on our new reports and solutions.
We do not share your information with anyone. However, we may send you emails on our new reports and solutions.
Request for Quotation
We do not share your information with anyone. However, we may send you emails on our new reports and solutions.
Get The Free Sample
BCG Analysis Report
This report is shared in order to give you an idea of what the complete BCG Analysis Report will cover after purchase. We invest deep in order to bring you insightful research which can add tangible value to your business or academic goals, at such affordable pricing.
Get this report delivered straight into your email inbox for free.
You also agree to receive email updates from us on our new reports and solutions.
We do not share your information with anyone. However, we may send you emails on our new reports and solutions.
Request for Quotation
We do not share your information with anyone. However, we may send you emails on our new reports and solutions.
Get The Free Sample
Digital Marketing and Social Media Strategy Analysis Report
This report is shared in order to give you an idea of what the complete Digital Marketing and Social Media Strategy Analysis Report will cover after purchase. We invest deep in order to bring you insightful research which can add tangible value to your business or academic goals, at such affordable pricing.
Get this report delivered straight into your email inbox for free.
You also agree to receive email updates from us on our new reports and solutions.
We do not share your information with anyone. However, we may send you emails on our new reports and solutions.
Request for Quotation
We do not share your information with anyone. However, we may send you emails on our new reports and solutions.
Get The Free Sample
Segmentation, Targeting and Positioning (STP) Analysis Report
This report is shared in order to give you an idea of what the complete Segmentation, Targeting and Positioning (STP) Analysis Report will cover after purchase. We invest deep in order to bring you insightful research which can add tangible value to your business or academic goals, at such affordable pricing.
Get this report delivered straight into your email inbox for free.
You also agree to receive email updates from us on our new reports and solutions.
We do not share your information with anyone. However, we may send you emails on our new reports and solutions.
Request for Quotation
We do not share your information with anyone. However, we may send you emails on our new reports and solutions.
Get The Free Sample
Ansoff Matrix Analysis Report
This report is shared in order to give you an idea of what the complete Ansoff Matrix Analysis Report will cover after purchase. We invest deep in order to bring you insightful research which can add tangible value to your business or academic goals, at such affordable pricing.
Get this report delivered straight into your email inbox for free.
You also agree to receive email updates from us on our new reports and solutions.
We do not share your information with anyone. However, we may send you emails on our new reports and solutions.
Check Out Analysis of Other Relevant Companies
References used in LG Electronics, Inc. SWOT & PESTLE Analysis Report
1. LG performance results 2020 - https://www.lg.com/global/pdf/ir_report/20%201Q%20Earning%20Release%20of%20LGE.pdf
2. LG Financial results 2019 - http://www.lgnewsroom.com/2020/01/lg-announces-2019-financial-results/
3. LG revenue 2019 - https://ace.electronicsforu.com/buzz/finance/53-billion-lg-electronics-revenue-in-2019/
4. LG company website - http://www.lgcorp.com/
The detailed complete set of references are available on request in the 'Complete report' on purchase.
How to Reference This Page?
You can use the following in your reference section in order to give credit to the source. For different referencing styles and detailed guidelines, please click here.
LG Electronics SWOT and PESTLE Analysis - SWOT & PESTLE.COM
SWOT & PESTLE.com (2024). LG Electronics SWOT and PESTLE Analysis - SWOT & PESTLE.com. [online] Available at: https://www.swotandpestle.com/lg-electronics/ [Accessed 25 Apr, 2024].
In-text: (SWOT & PESTLE.com, 2024)
Copyrights and Disclaimer
LG SWOT and PESTLE analysis has been conducted and reviewed by senior analysts from Barakaat Consulting.
Copyright of LG SWOT and PESTLE Analysis is the property of Barakaat Consulting. Please refer to the Terms and Conditions and Disclaimer for usage guidelines.
 Safe and secure payments
 Safe and secure payments


